

Analytics
Accessing Reown Analytics
To access Reown Analytics and explore these insightful features, follow these simple steps:
- Log In to your Cloud Account here.
- Click on your Project.
- Click the Analytics Tab.
- Select the Analytics section of your choice.
By following these steps, you can easily access and leverage Reown Analytics to track your project's progress and make informed decisions to take your project to the next level.
Understanding Reown Analytics
WalletConnect Dashboard now includes Analytics to help you better understand your project's performance. Let's break down some terms and explore the new analytics sections in a simple manner.
Analytics Sections
Definitions
Refer to Definitions for the meaning of terms used in Reown Analytics.
Relay
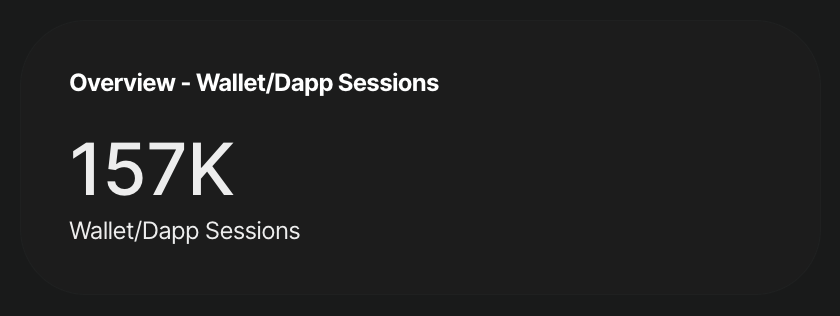
Overview - Wallet/Dapp Sessions
Displays the total count of established connections between your project and Reown SDK.
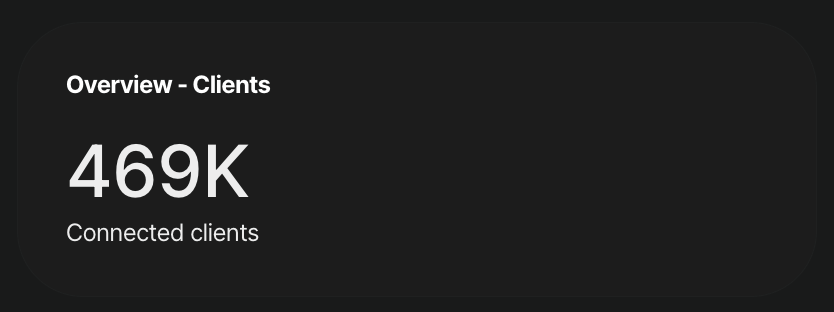
Overview - Clients
Indicates the total number of connections established from clients (device or browser if connecting on the web).
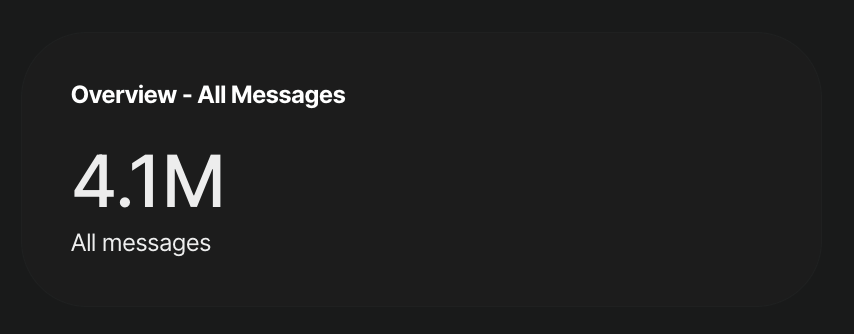
Overview - Messages
Shows the total messages exchanged between the configured Reown SDK and the Relay Server.
Wallet/Dapp Sessions
Shows the daily trend of established sessions over a 30 day period.

Clients
Shows the daily trend of client connections over a 30 day period.

All Messages
Shows the daily trend of messages connections over a 30 day period.

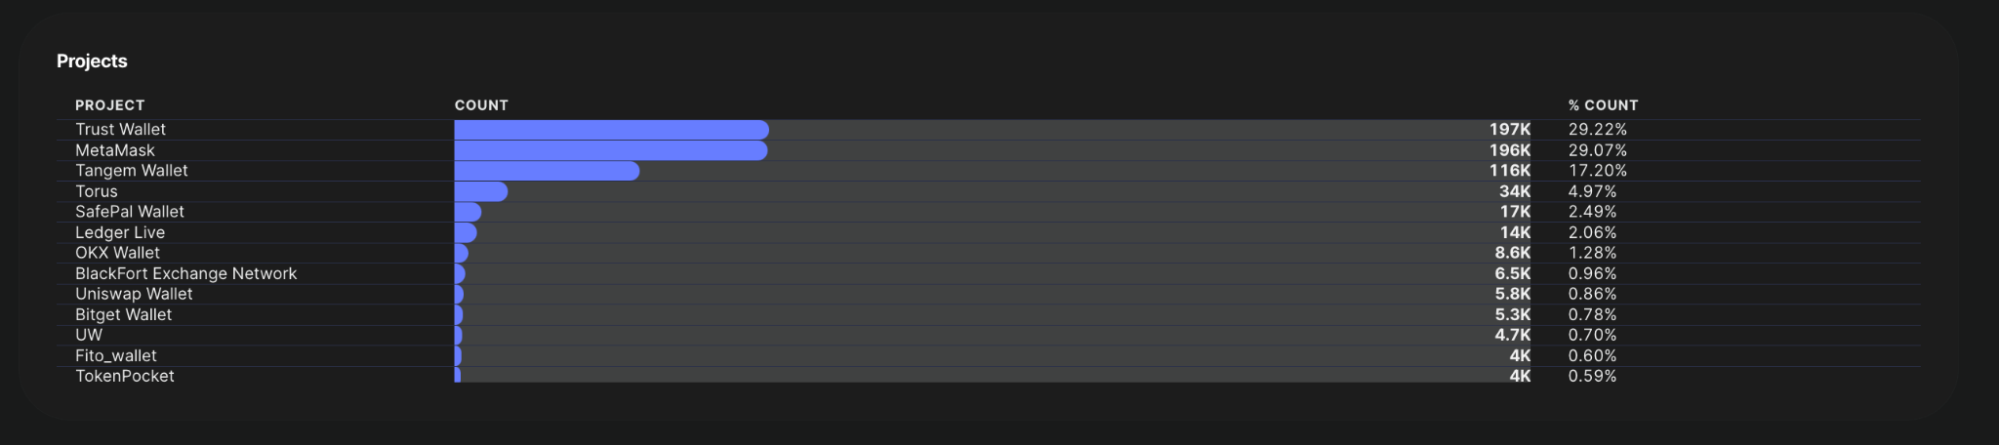
Projects
Lists the top ranked wallets/Dapps connected to your project.
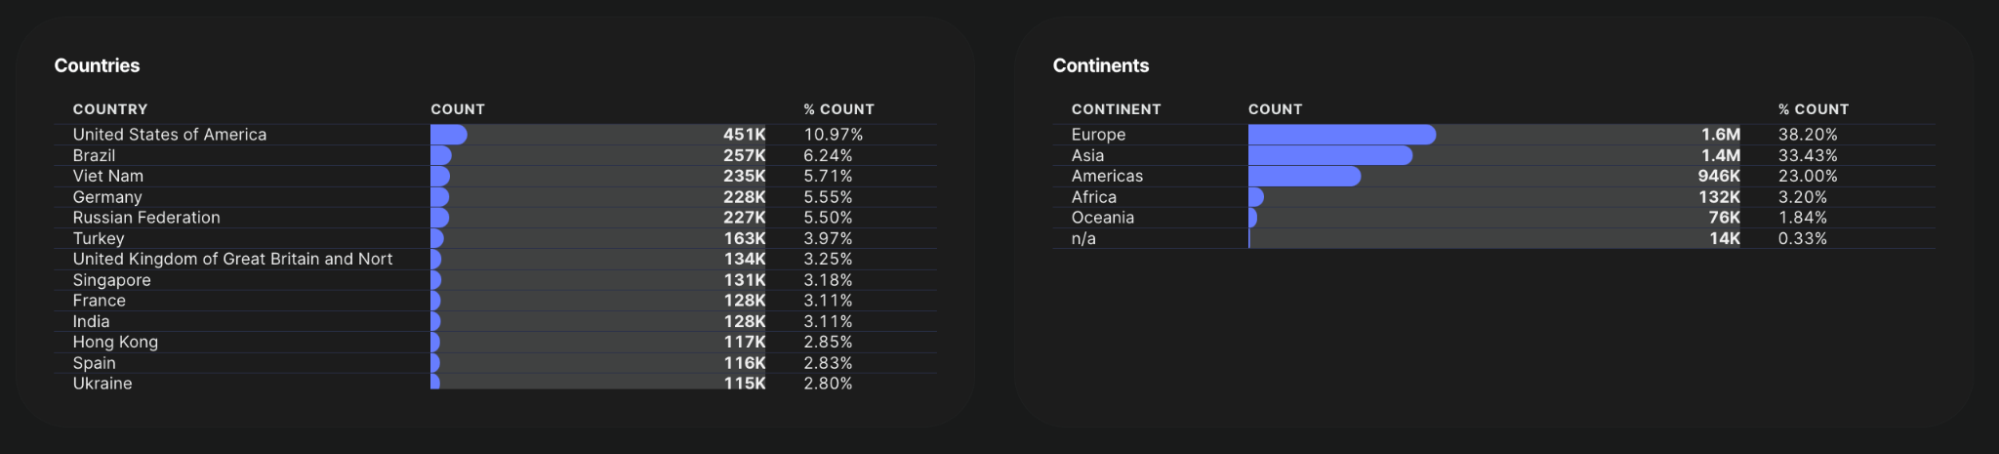
Countries and Continents
Provides insights into user connections by displaying the countries and continents with the most connections.
Learn more about the Relay here
RPC
Overview RPC Requests
Represents the total count of remote procedure calls (RPC) made to the blockchain API for the last 30 days.

RPC Request Volumes
Displays the daily trend of API requests made to the blockchain API.

RPC Chain
Shows the top chain requests made by Chain ID.

RPC Method
Highlights the top-ranked methods called by your users.

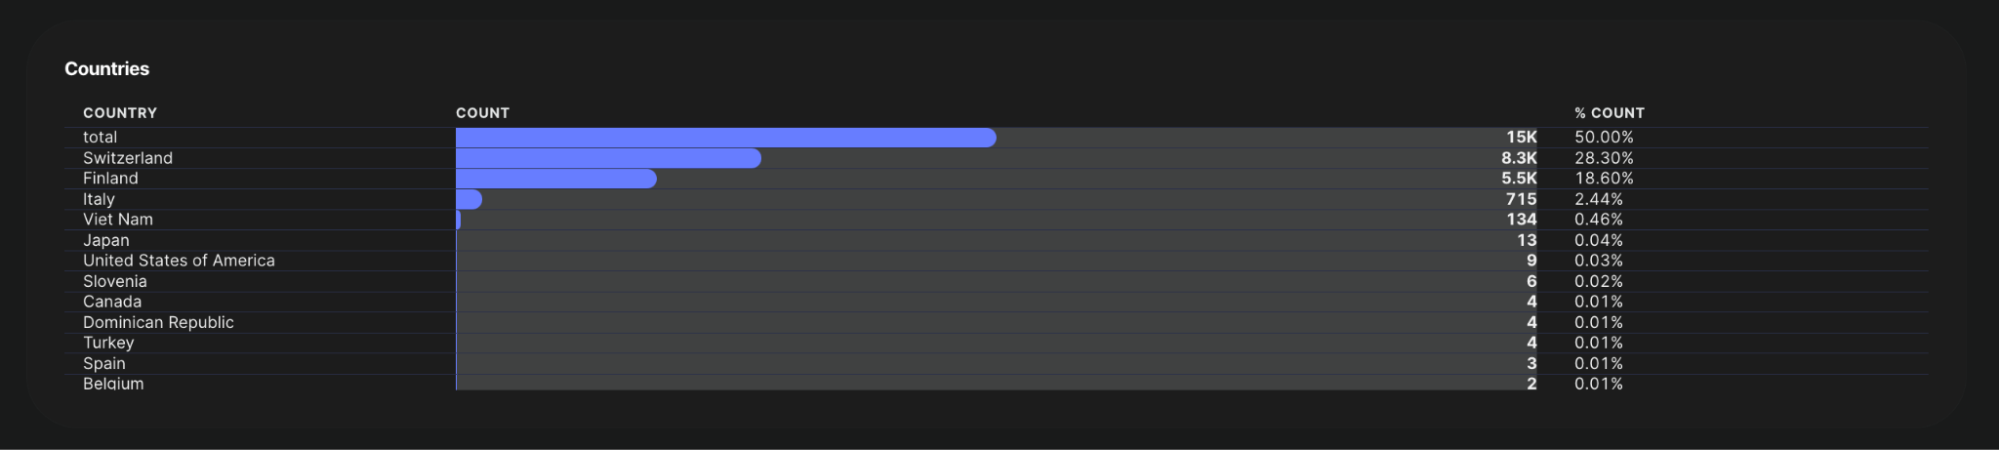
Countries
Illustrates user connections by displaying the countries with the most connections.
Learn more about the Blockchain API here
AppKit
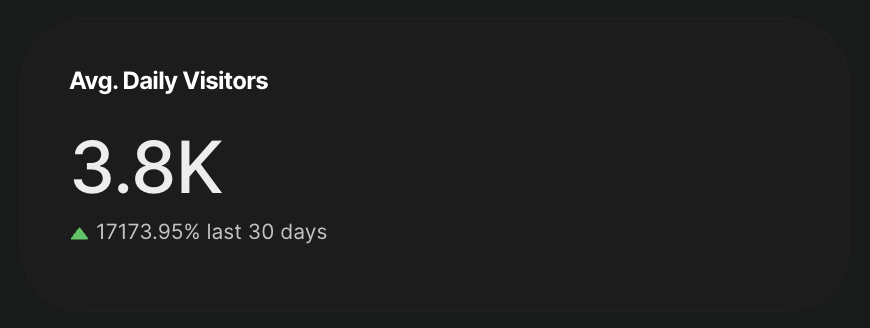
Avg. Daily Visitors
Indicates the daily average of unique visitors to your app’s AppKit.
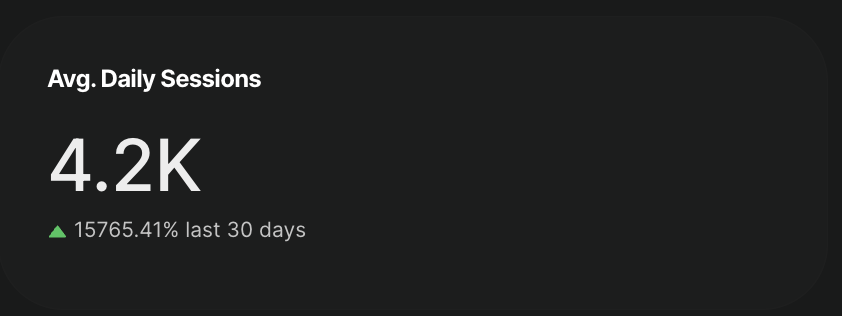
Avg. Daily Sessions
Indicates the daily average of sessions.
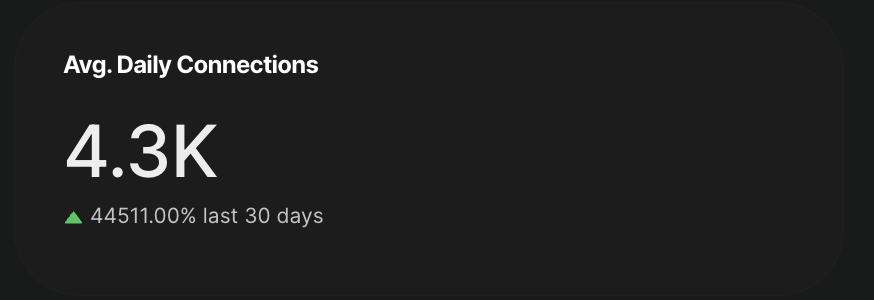
Avg. Daily Connections
Indicates the daily average of connections made through AppKit.
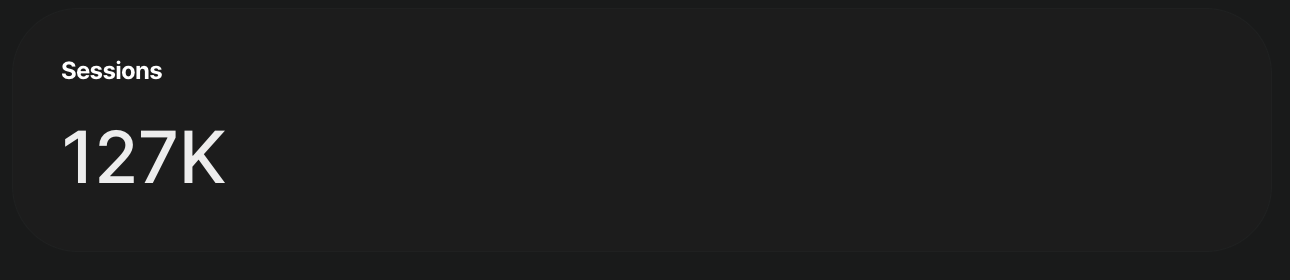
Sessions
Indicates the total count of sessions.
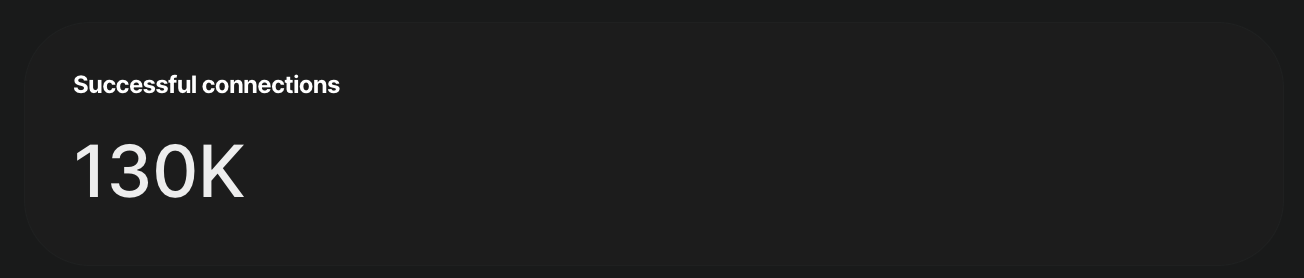
Successful connections
Total count of all connections made between a wallet and your app.
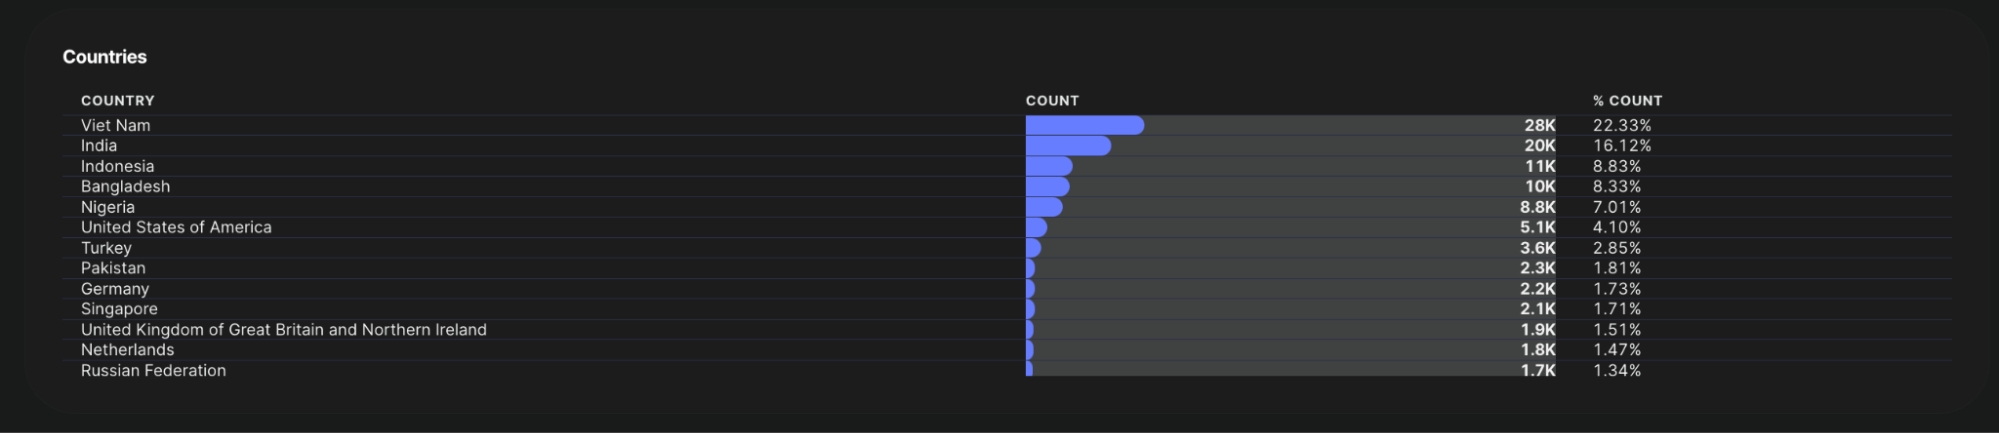
Countries
Ranks the top countries with the highest user connections.
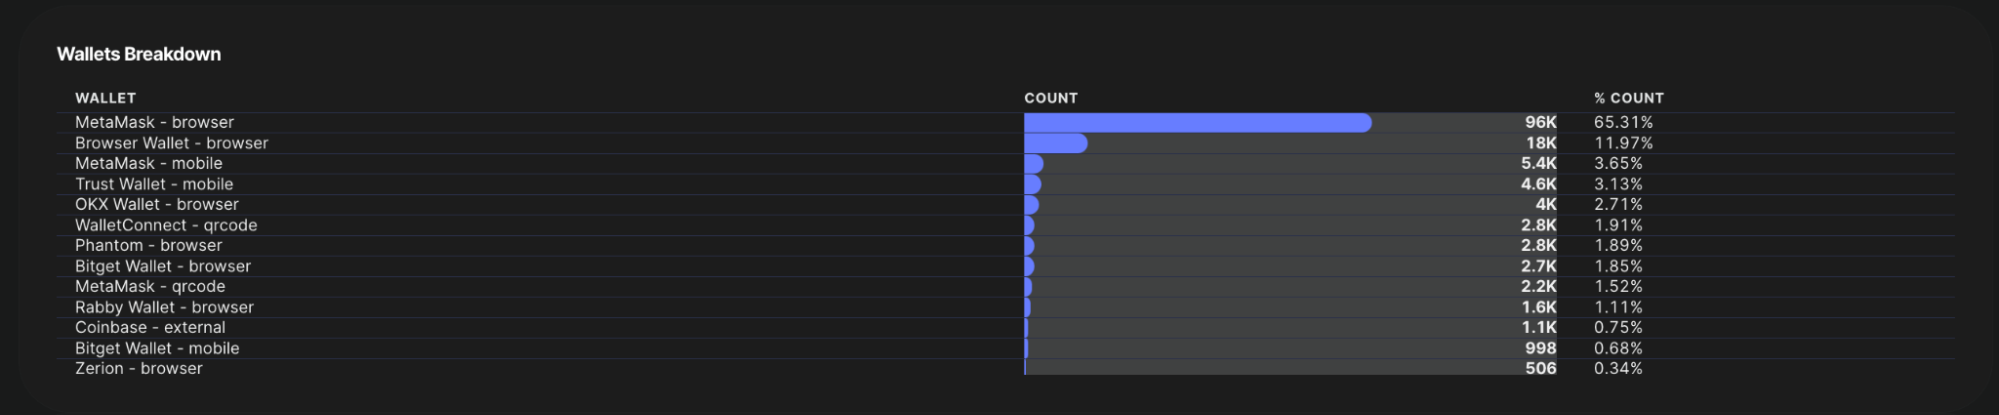
Wallets Breakdown
Ranks the top wallets that your users are connecting from.
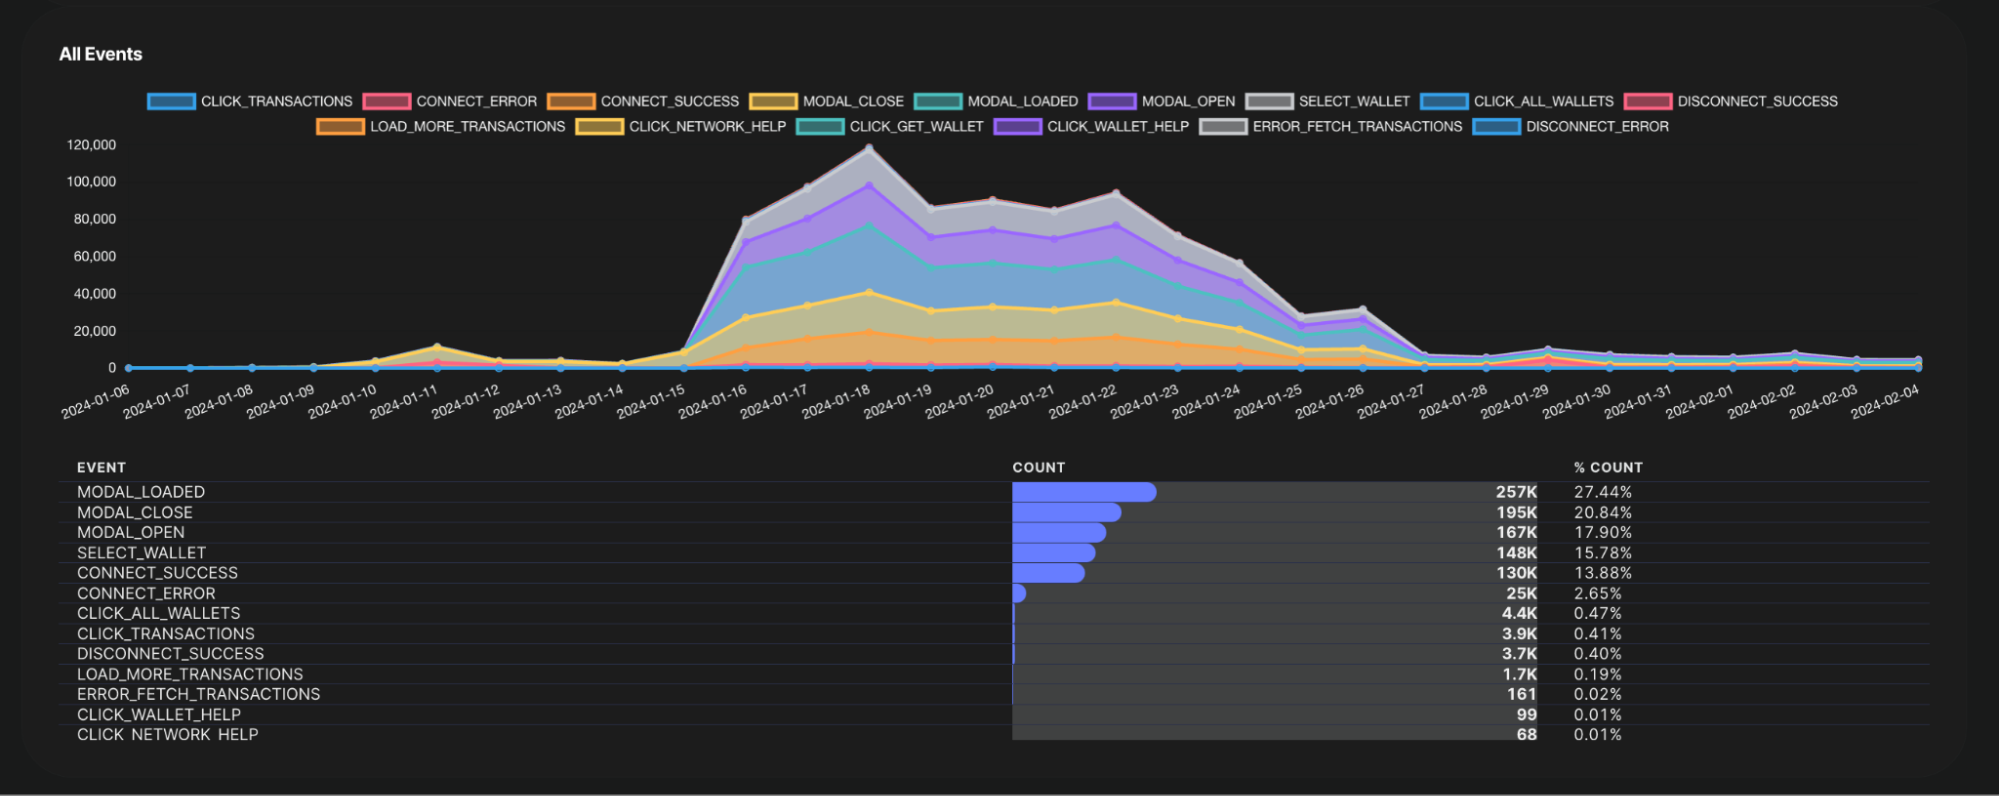
All Events
This table and chart shows the count of various events that are triggered as the users interact with AppKit.
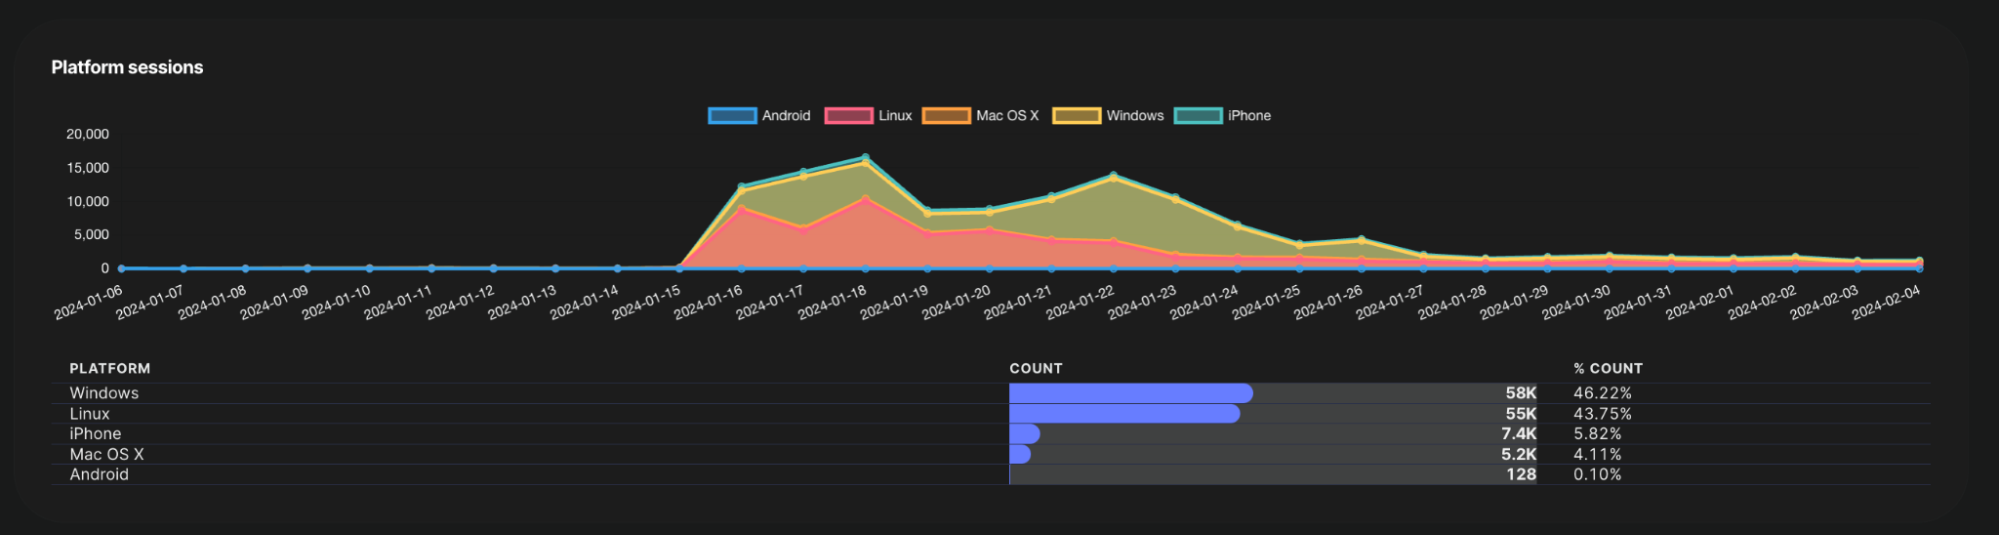
Platform Sessions
Provides a breakdown of sessions that have been created by device platform.
Visitors
Shows the daily trend of unique visitors to your app’s AppKit.

Sessions
Shows the daily trend of sessions created when the user signs a message with their connected wallet.

Successful connections
Shows the daily trend of successful connections to your app.

Definitions
Definitions of terms used in Reown Analytics.
| Term | Description |
|---|---|
| Relay:Session | A session within the context of Relay analytics denotes meaningful user actions, like signing transactions for NFT sales or trades, within a wallet or dapp. It emphasizes core SDK functionality. |
| AppKit:Session | A session within the context of AppKit analytics represents the connection established between your project and your user’s device (includes browsers). Sessions are created when the user interacts with AppKit on your app. If user events are tracked within a 30-minute range, they will be considered within the same session. |
| Message | Messages are data exchanges between the Reown SDK and the Relay Server, facilitating communication between your project and connected clients. |
| Client | A client is a device or browser connected to your project. |
| Blockchain API | The interface that allows your project to interact with the blockchain. Remote Procedure Calls (RPC) are used to request information or execute operations on the blockchain through this API. |
| Chain ID | Chain ID identifies a specific blockchain network. Different blockchain networks, such as Ethereum Mainnet or a testnet, have unique Chain IDs. |